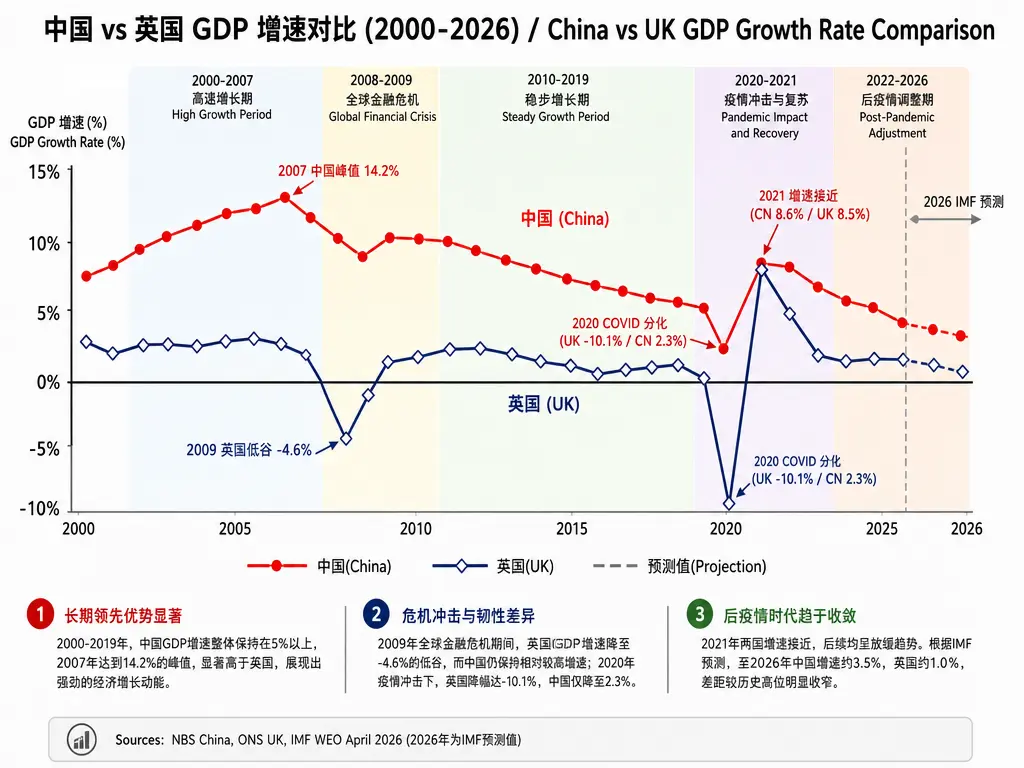
Dual-line chart infographic in 3:4 vertical layout comparing China versus UK GDP growth rates 2000-2026. Z-pattern reading flow: bilingual title "中国 vs 英国 GDP 增速对比 (2000-2026) / China vs UK GDP Growth Rate Comparison" at top, dual-line chart occupying central two-thirds, three insight takeaways below chart, source footer at bottom. Chinese text in Noto Sans CJK SC, English text in Inter. Title at 24px bold, axis labels at 11px, annotations at 10px, source footer at 9px. Chart x-axis from 2000 to 2026 with tick labels at 2000, 2005, 2010, 2015, 2020, 2025. Y-axis from -12% to +16% with tick labels at -10%, -5%, 0%, 5%, 10%, 15%. Zero-line at y=0 drawn at 1.5x thickness in #64748B. China GDP series in #DE2910 continuous solid line with 6px filled circle markers (2000-2025 actual data). UK GDP series in #0F2B6B continuous solid line with 7px hollow diamond markers (2000-2025 actual data). Projected value for 2026 only uses same color lines but dashed style (6px dash, 3px gap) — 2025 is confirmed actual data from NBS/ONS, not a projection. Vertical separator between 2025 and 2026 in #CBD5E1 to demarcate boundary between actual data zone (2000-2025) and IMF projection zone (2026). Series labels "中国 China" anchored above the red line at year 2000, "英国 UK" below the blue line at year 2000. Chart background #FFFFFF on canvas #F8F9FA with grid lines in #E2E8F0. Legend in top-left quadrant showing ━ 中国(China) / ━ 英国(UK) / ╌ 预测值(Projection). Five vertical era bands at 10% opacity of #E2E8F0 spanning full chart height behind grid: WTO integration (2000-2007), GFC (2008-2009), Post-crisis (2010-2019), COVID (2020-2021), Post-COVID recovery (2022-2026). Seven annotation points distributed around chart periphery: 2007 China peak 14.2%, 2009 UK trough -4.6%, 2020 COVID divergence (UK -10.1% / CN 2.3%), 2021 convergence with bracket "2021 增速接近" showing CN 8.6% above UK 8.5%, 2025 latest actual data (NBS/ONS confirmed), 2026 IMF projection. Below chart area: three text blocks presenting narrowing growth gap analysis. Footer row: "Sources: NBS China, ONS UK, IMF WEO April 2026" with parenthetical note "2026年为IMF预测值". Negative space approximately 32%.